Overview
— Project Statement
Oh, Baby!
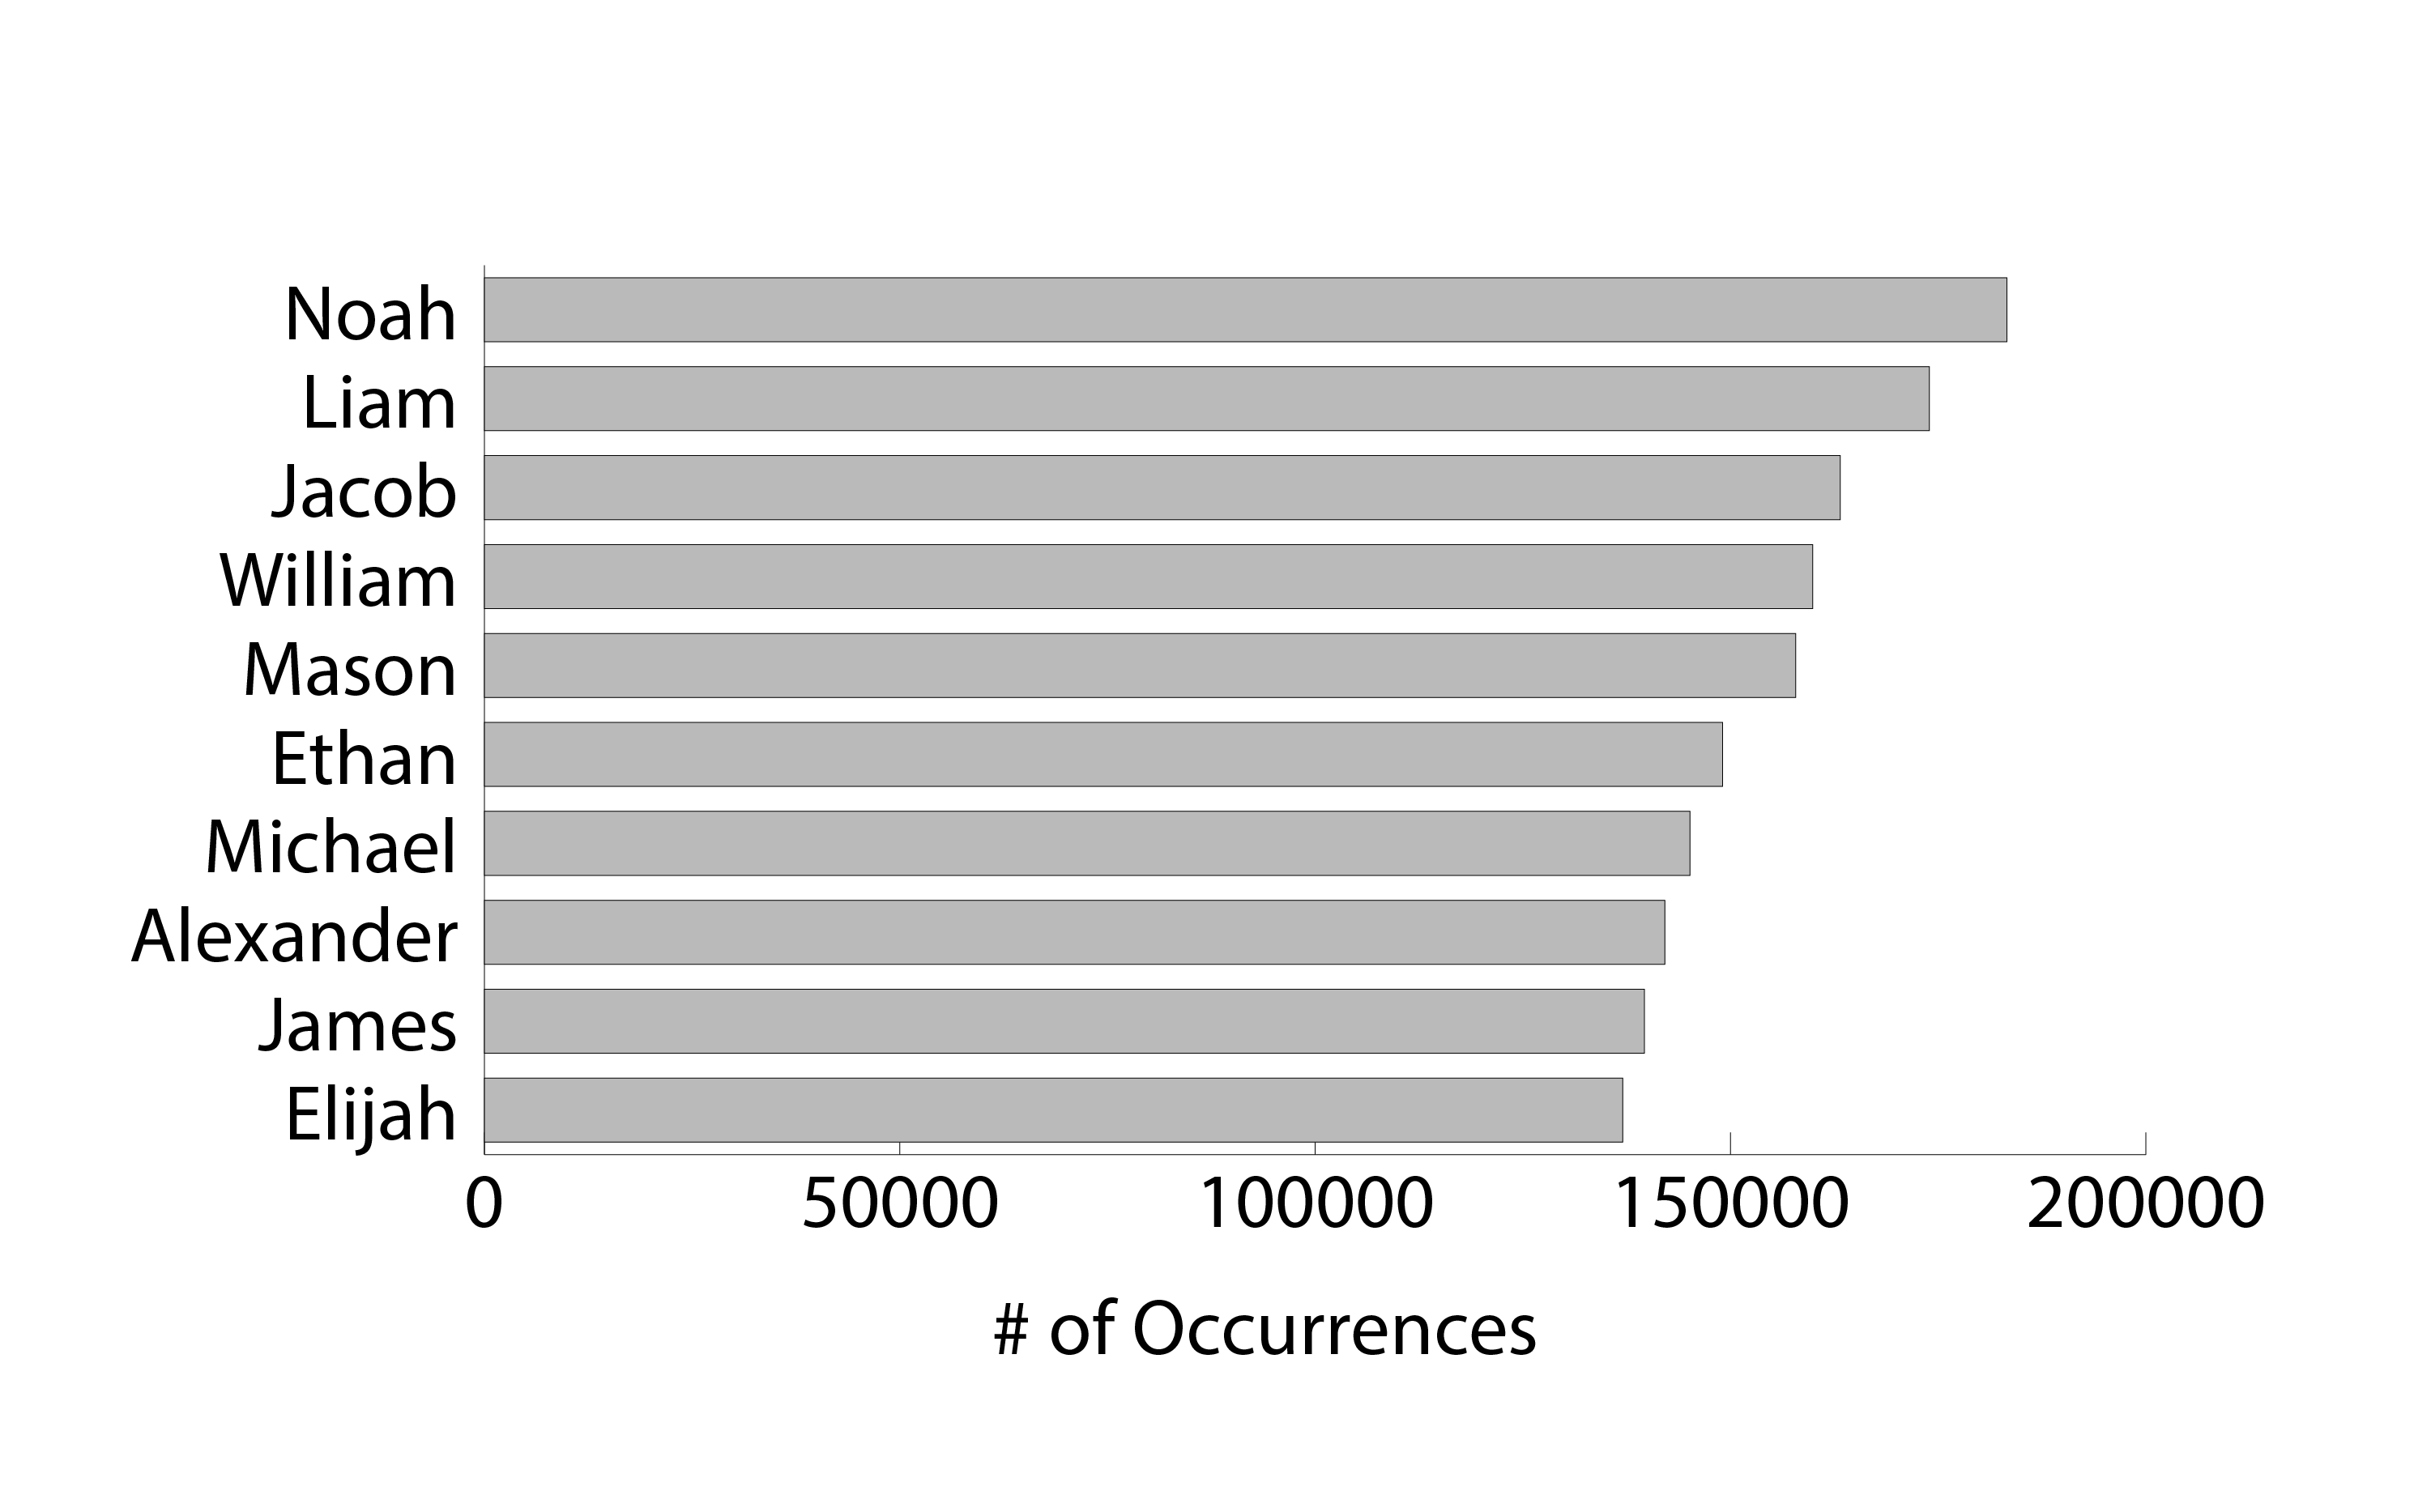
This project showcases working with data visualization using Adobe Illustrator, merging data insights with creative design with data sourced from the Social Security Administration. It features three types of graphs: a pie chart illustrating a century of popular baby names, two bar charts for the top ten baby names of the 2010s, and an area chart tracking naming trends by decade. The charts utilize gradients, shadows, and transparency tools enhance visual depth and clarity. Light pinks and blues, complemented by Reklame Script Bold and Swing King Regular fonts evoke a nursery theme.
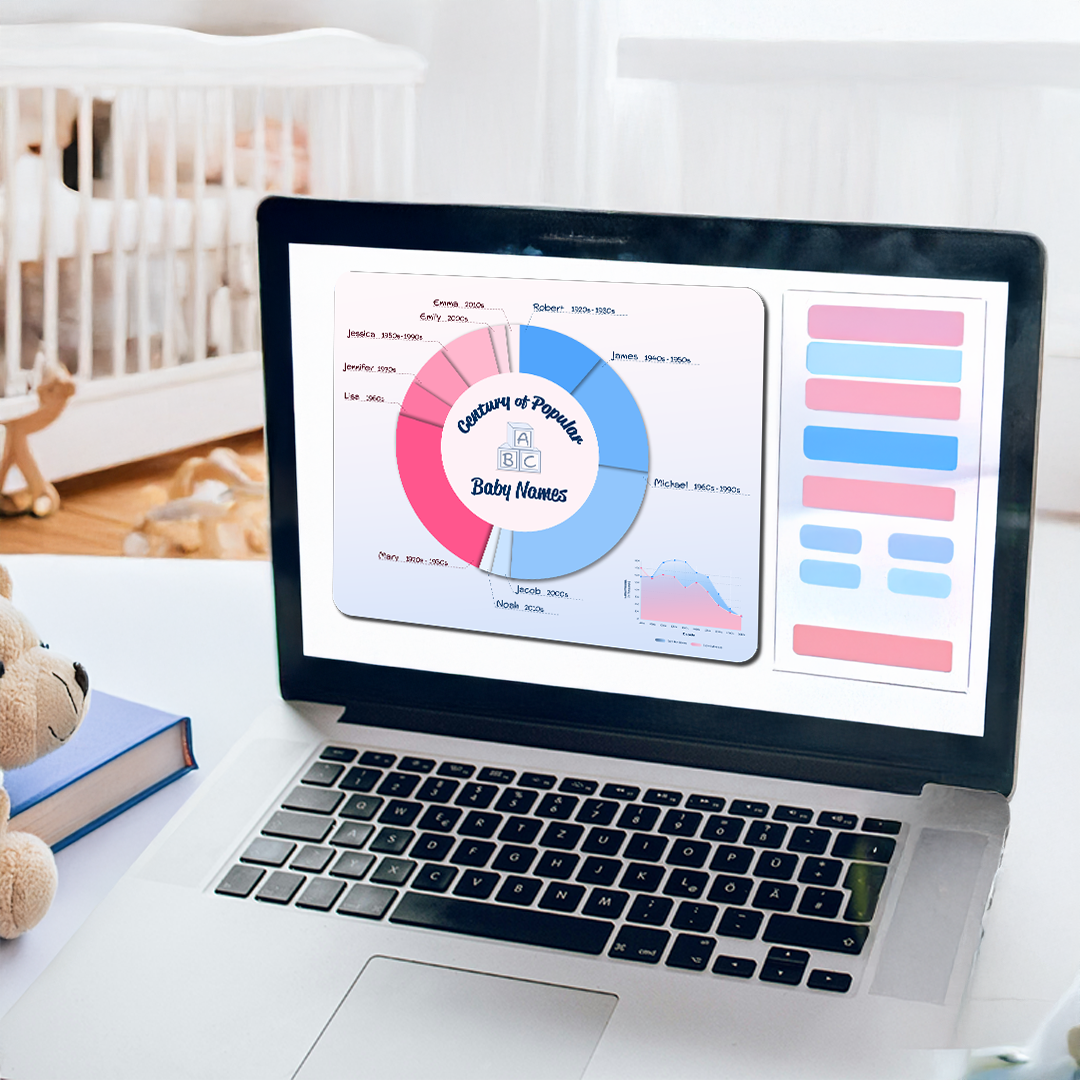

— Color & Type Studies

Process
— Data Insights of Popular Baby Names
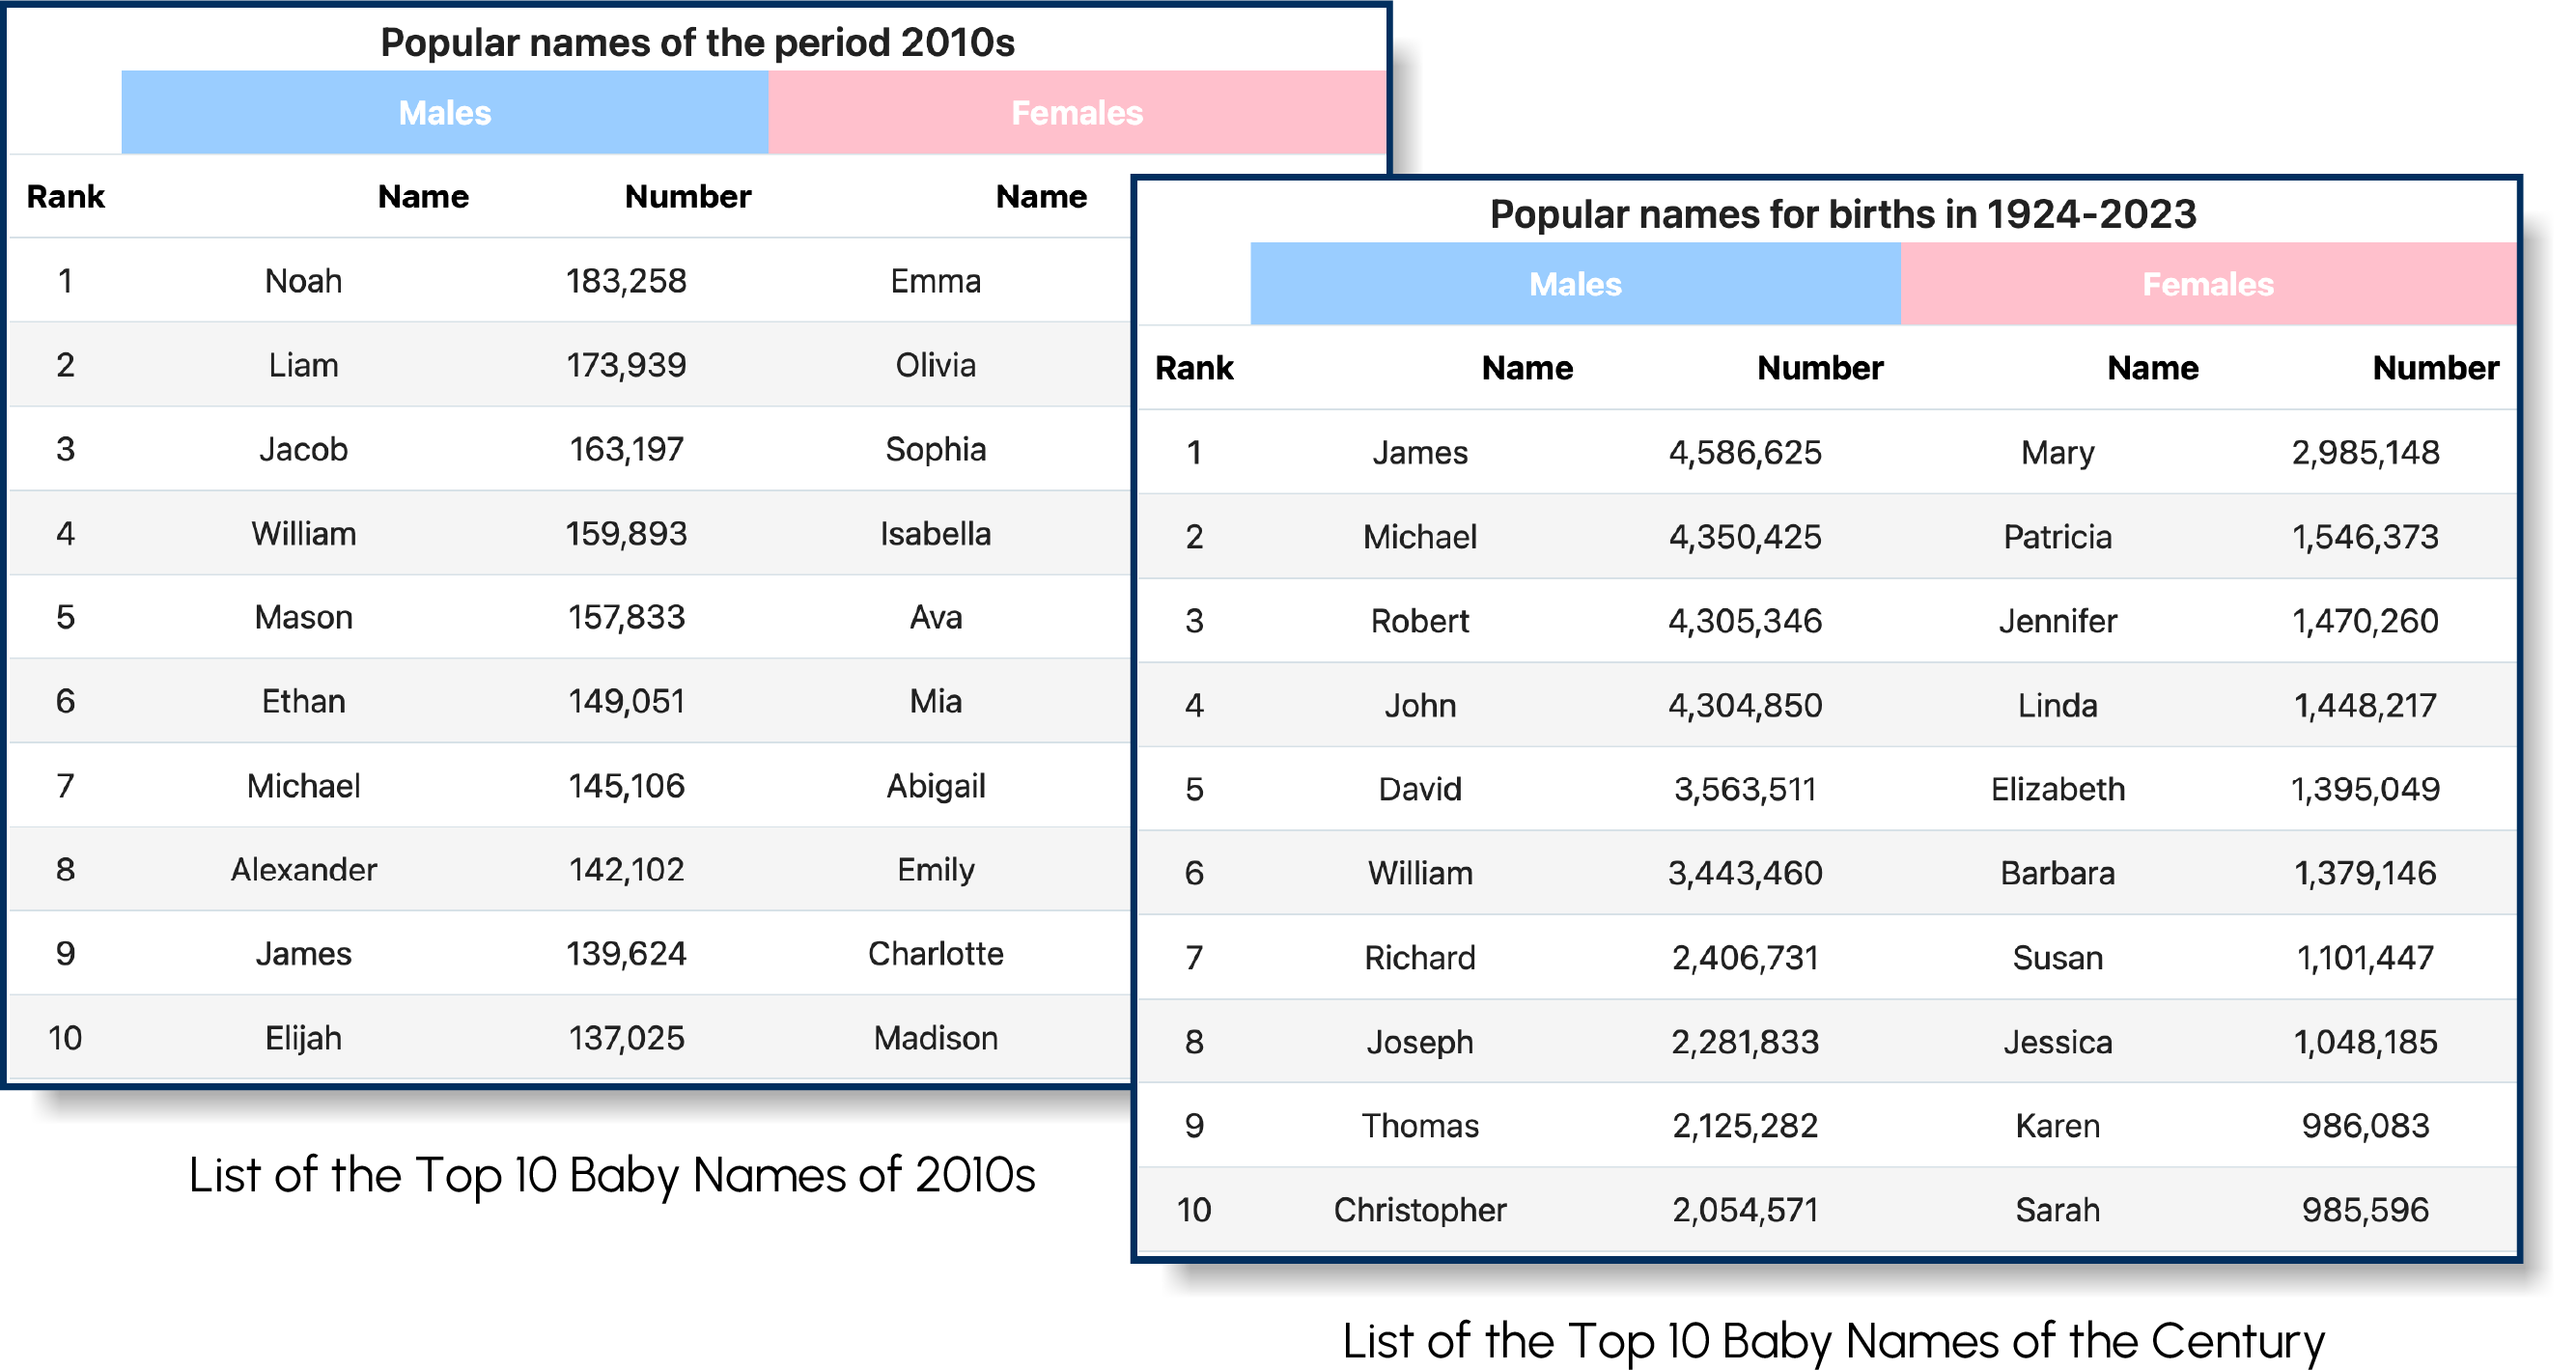
— Popular Baby Names of the Century Area Chart
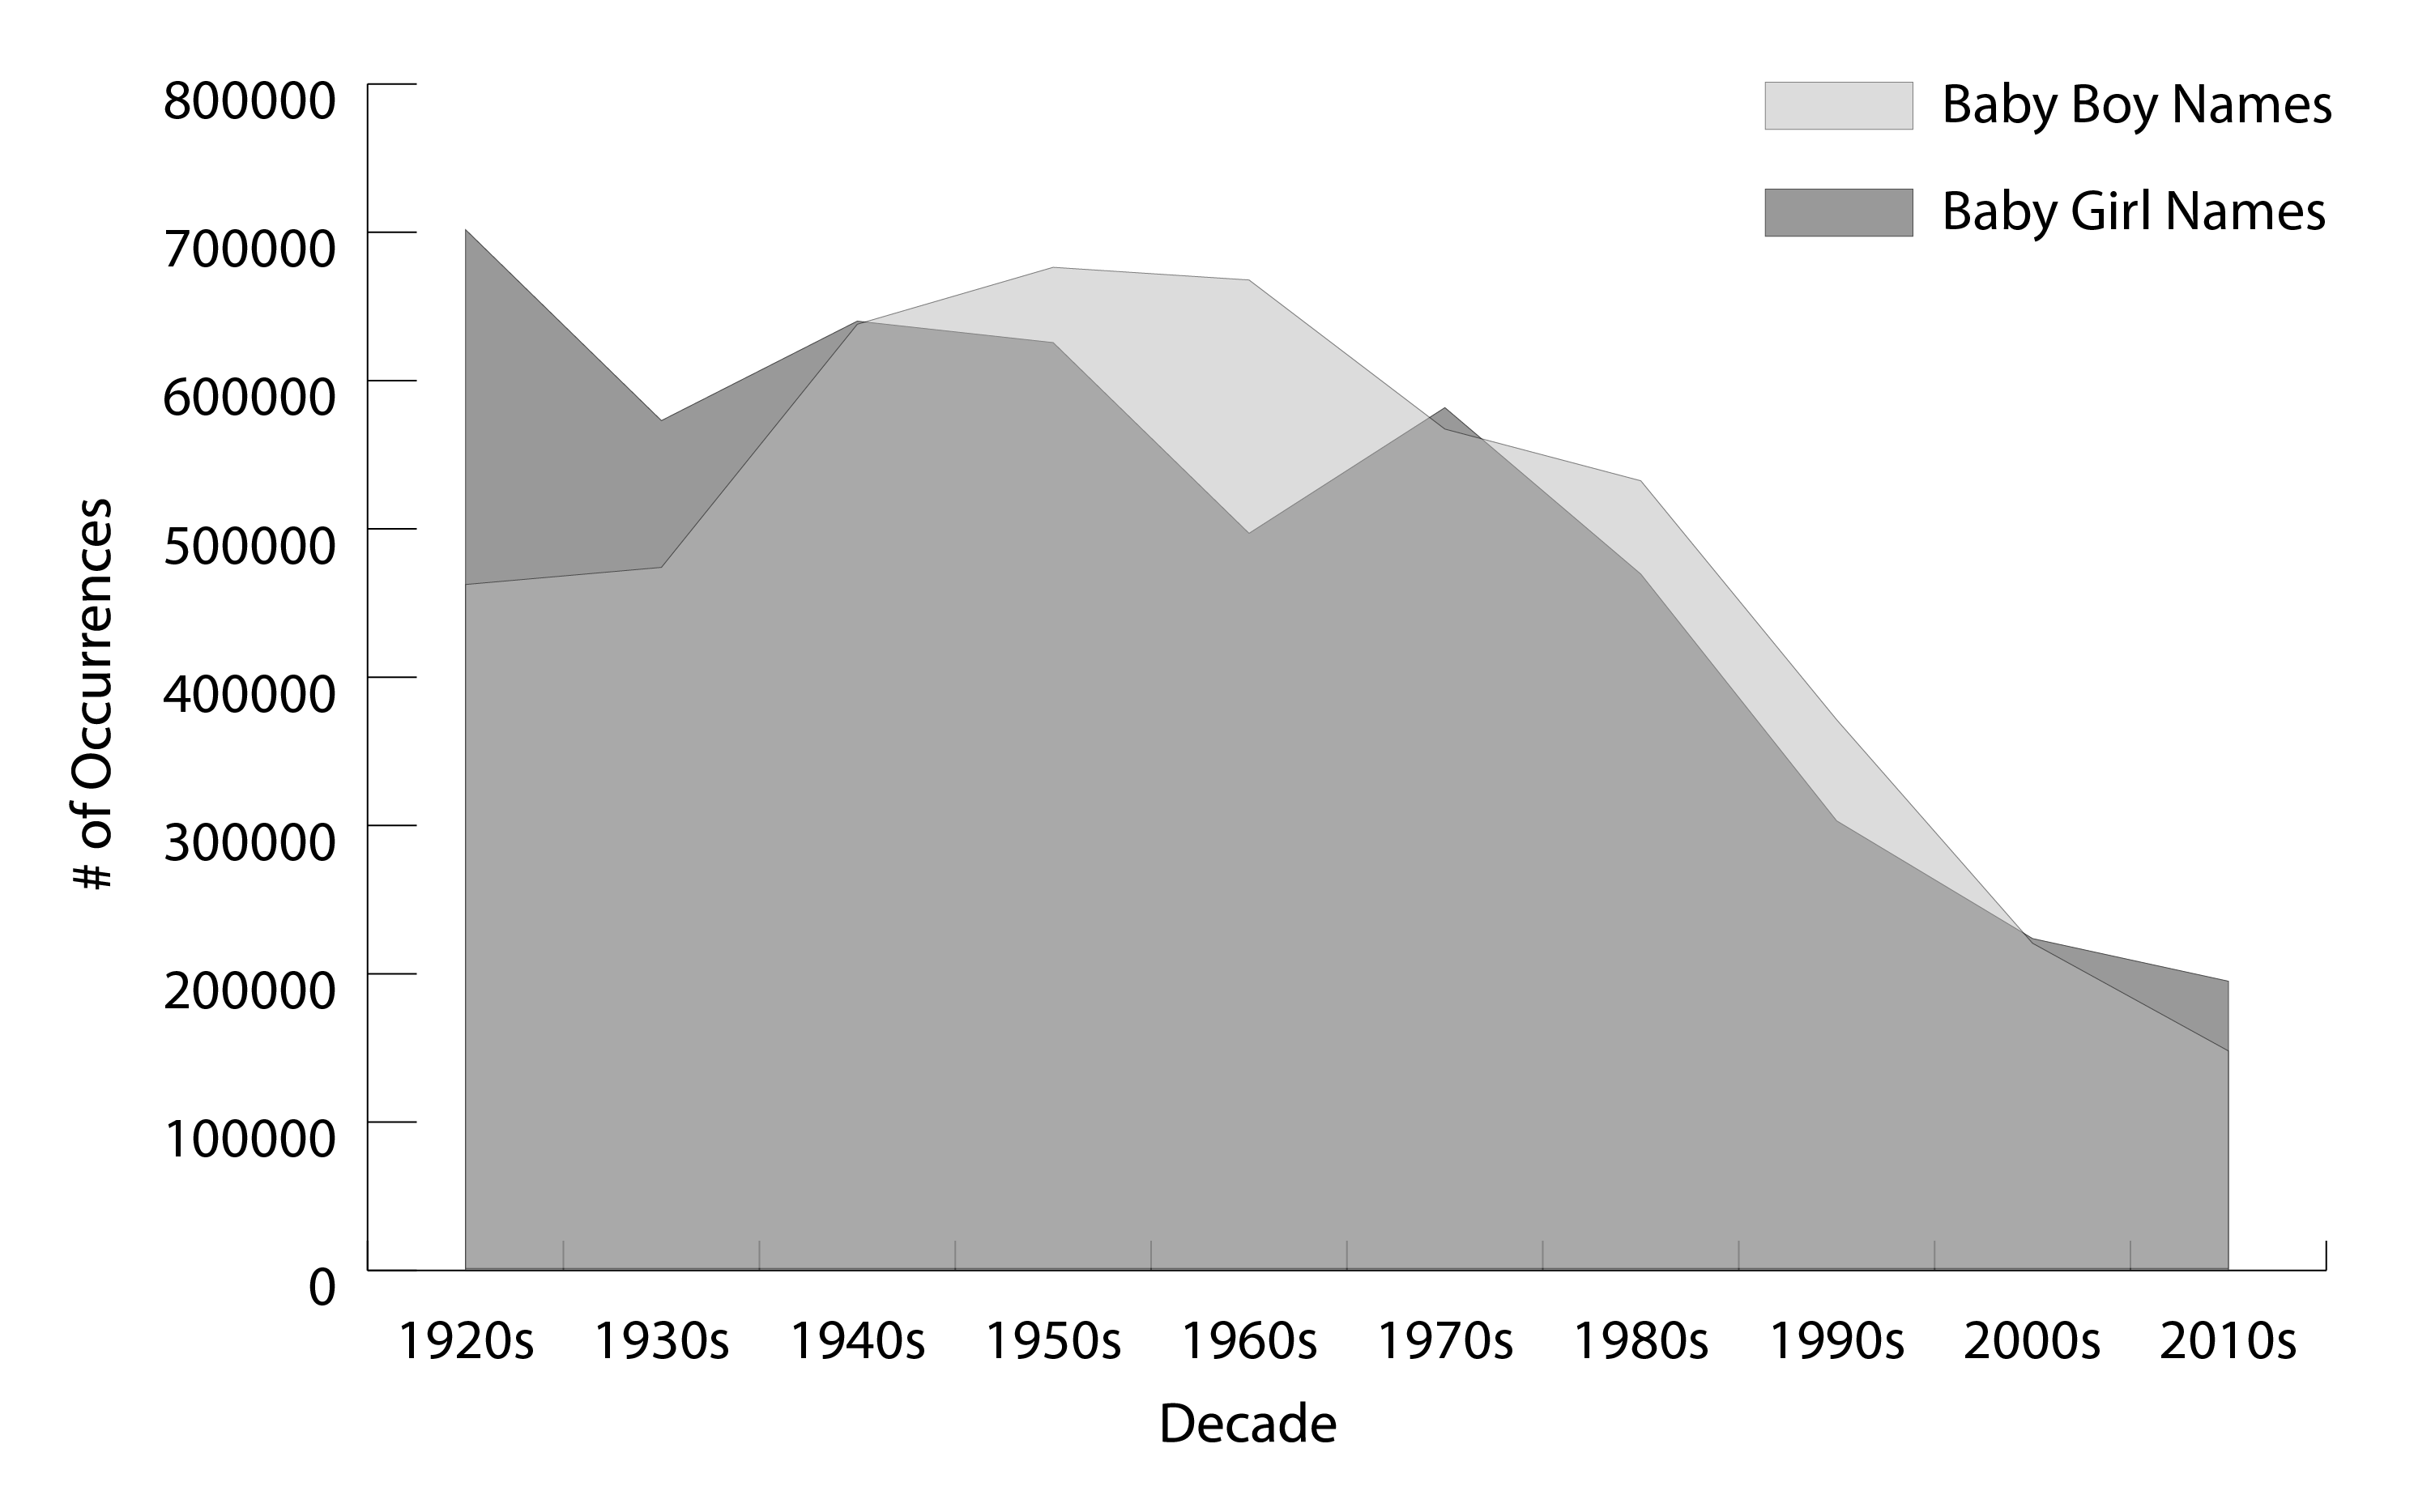
— Popular Baby Names of the 2010s Bar Charts
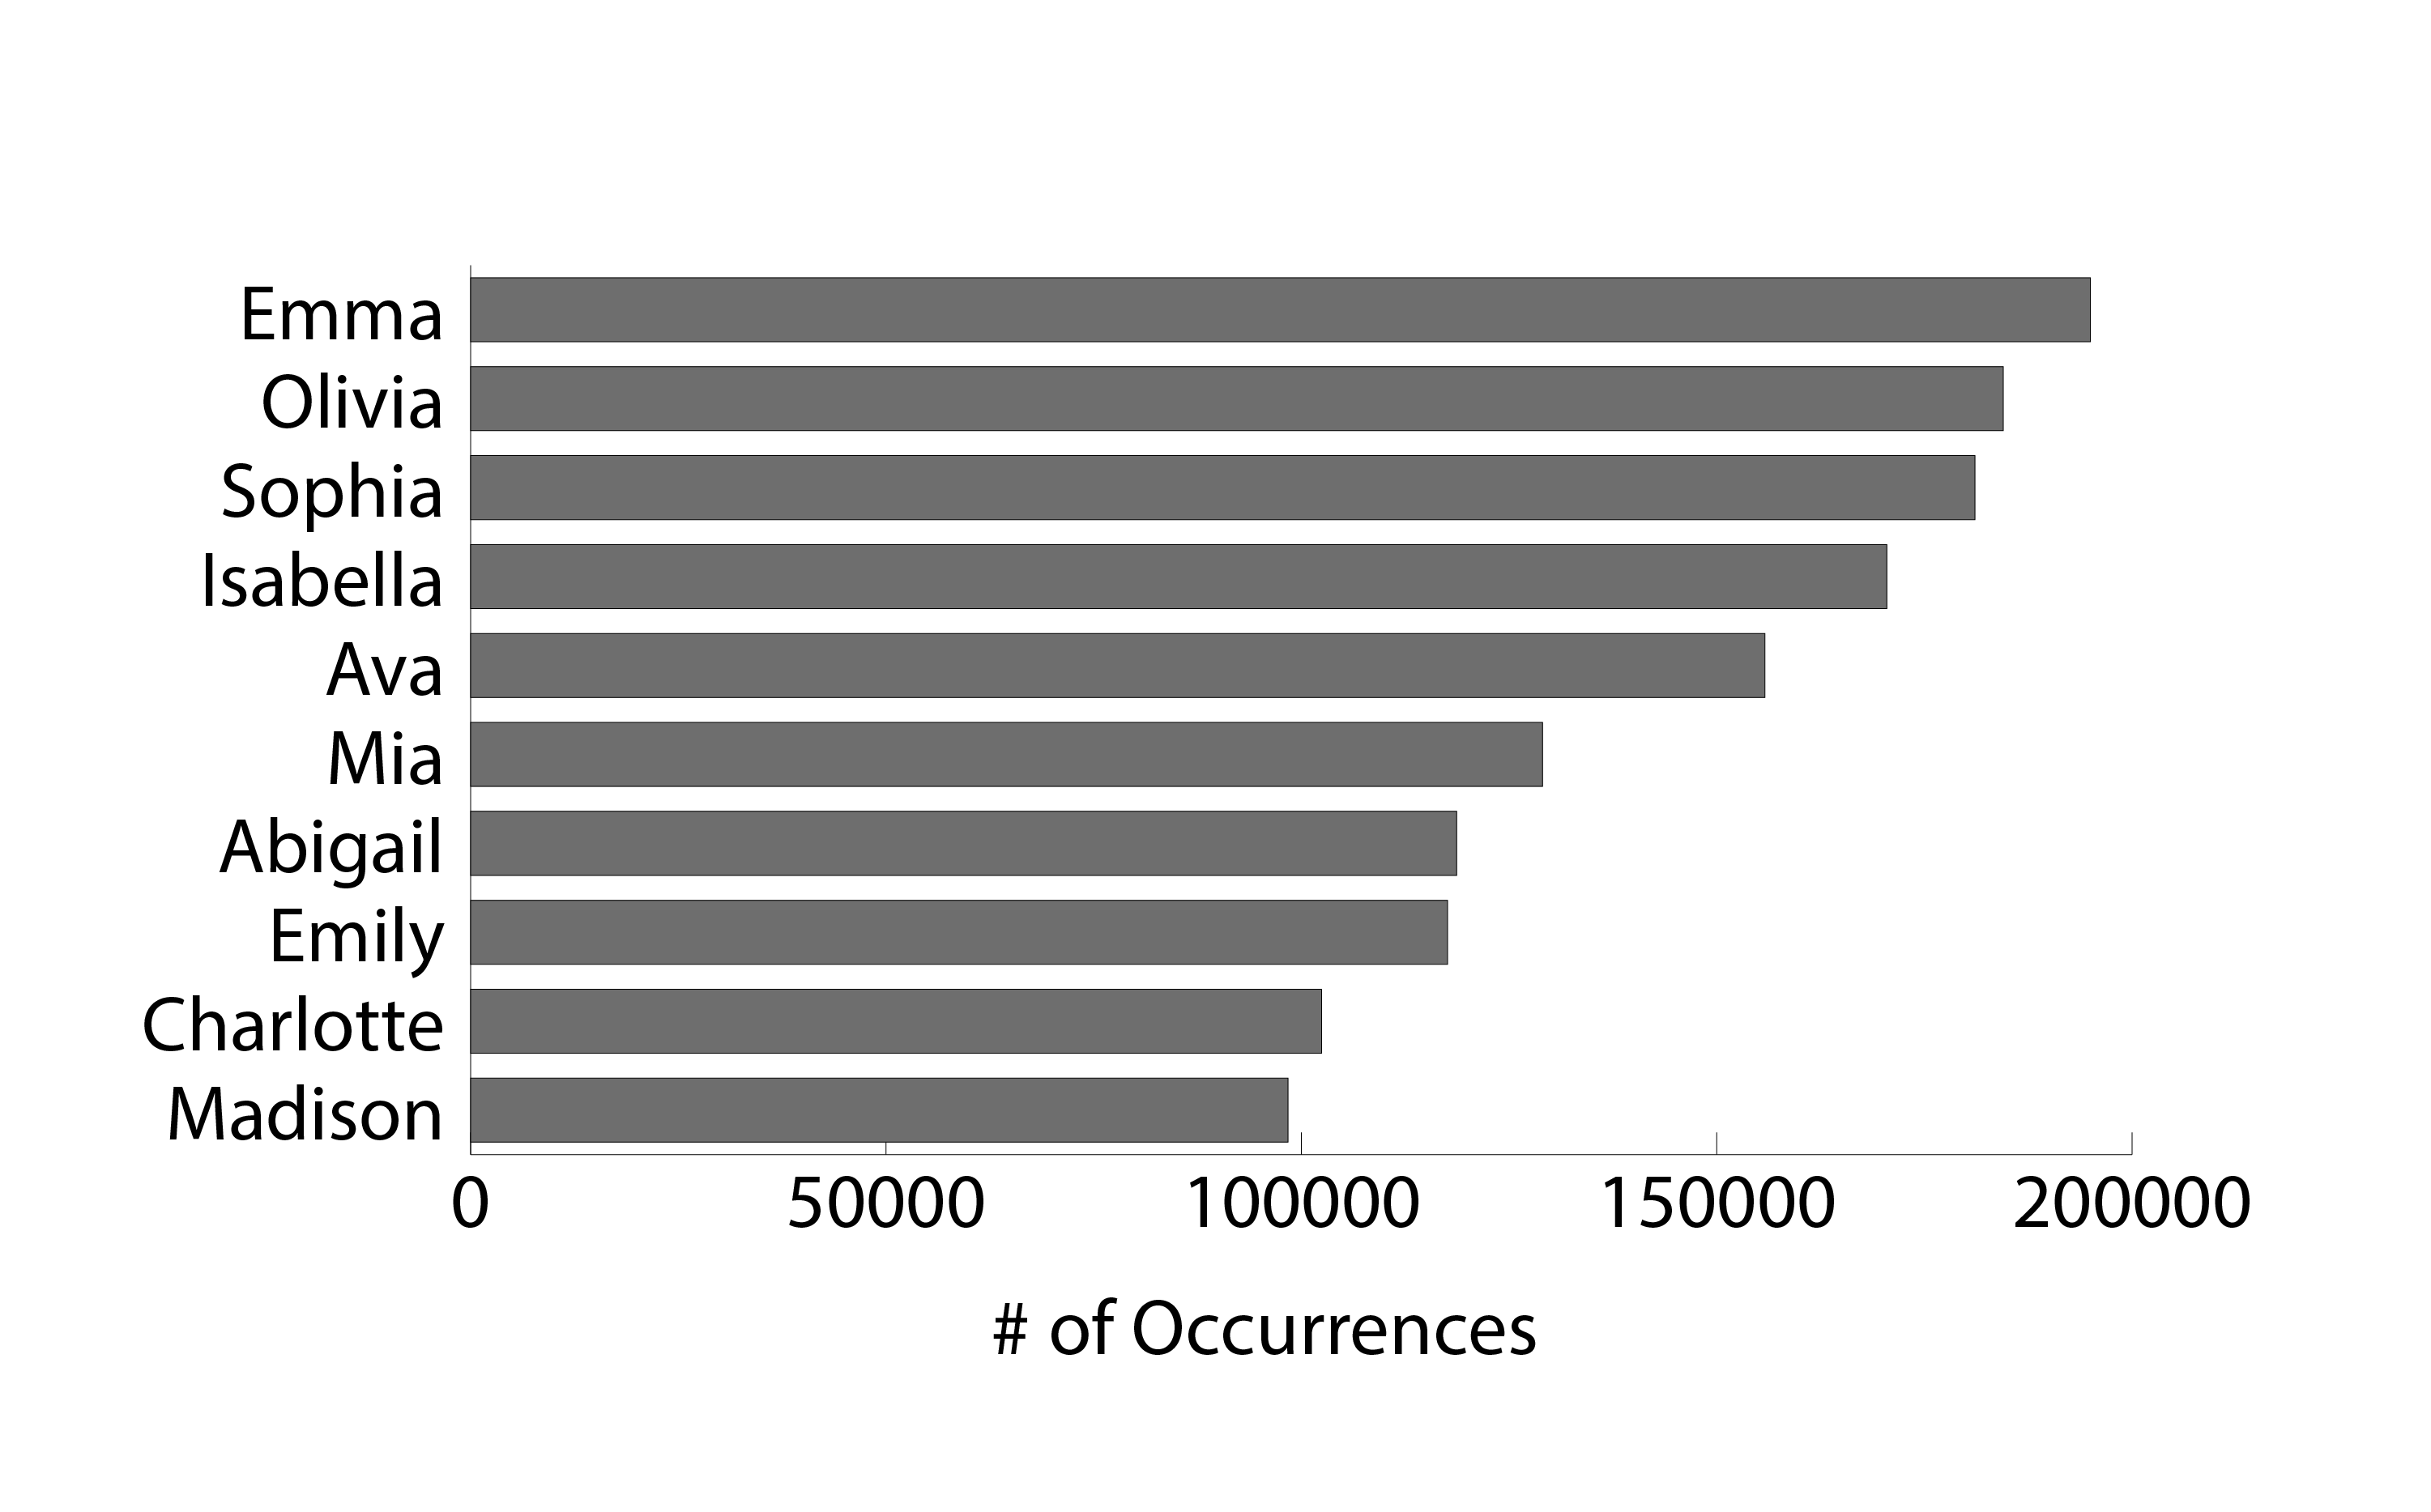
— Century of Popular Baby Names Pie Chart

— Most Popular Baby Girl & Baby Boy Names in 2010s Bar Charts


— Trends in Popular Baby Names by Decade Area Chart

